
· · Lucie Dewaleyne · Blog · 4 min read
Website speed: why every second is costing you customers
TL;DR: every extra 100ms of load time costs about 1% in conversions, and Google tightened its « good » LCP threshold to 2 seconds in 2026. A targeted performance diagnosis can recover that lost revenue before a redesign or campaign launch.
| Metric | Impact |
| Each extra 100ms of load time | -1% conversions |
| One-second load delay | -7% conversions |
| Google’s « good » LCP threshold (2026) | 2s (down from 2.5s) |
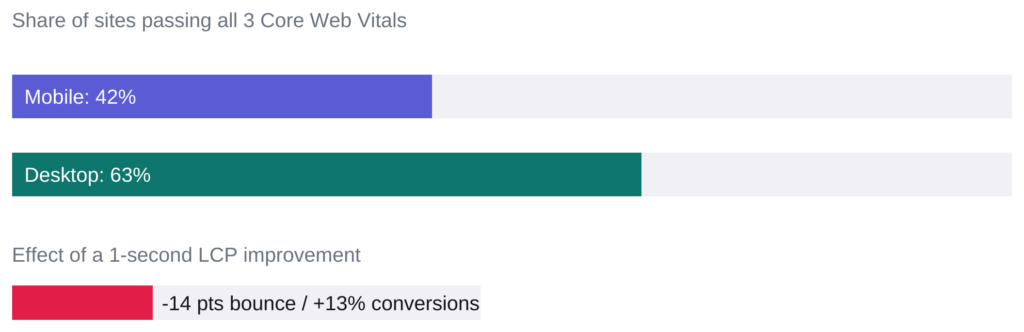
| Mobile sites passing all 3 Core Web Vitals | 42% (vs 63% desktop) |
| Rakuten 24 after LCP optimization (A/B test) | +53% revenue/visitor, +33% conversions |
A site that takes more than two seconds to load has already lost part of its visitors before they see a single offer. That is not a hunch, it is measurable. Every extra 100 milliseconds of load time costs about 1% in conversions, and a one-second delay cuts conversions by 7%. On an e-commerce site generating 10 million euros a year, shaving 500 milliseconds off load time works out to roughly 500,000 euros in recovered revenue.
One second too slow, and part of your audience leaves
Sites that pass all three of Google’s Core Web Vitals show a bounce rate about 24% lower on average than sites that fail at least one. Cutting LCP, the time it takes the largest visible element on a page to load, by one second drops bounce rate by 14 points and lifts conversions by 13%. These numbers are not from a single case study, they show up across sites of very different sizes and industries.
Google tightened the bar in 2026
The threshold for a « good » LCP score dropped from 2.5 seconds to 2 seconds. A site that loaded fine last year can now fall into the « needs improvement » bucket without a single line of code changing, simply because the bar moved. As a result, only 42% of mobile sites currently pass all three Core Web Vitals, against 63% on desktop. Mobile accounts for 62% of e-commerce traffic. The performance gap sits exactly where most of the sales happen.
Companies have already put a number on the gain
Rakuten 24 A/B tested a strong LCP score and saw revenue per visitor up 53% and conversions up 33%. Vodafone Italy improved LCP by 31% and saw sales grow 8%. RedBus focused on INP, the responsiveness to interactions, and gained 7% more sales. These are not theoretical promises, they are measured results on production sites at different scales.
A score alone does not tell you much
PageSpeed Insights and Lighthouse give a first score for free in a few seconds. But that single number does not say which page is losing the most traffic, on which device, or what gain is realistic once fixes are made. That is the difference between a score and a diagnosis: one flags a problem, the other prioritizes it. Without that prioritization, teams often end up optimizing the page that matters least while the one that actually converts keeps bleeding visitors.
What a performance diagnosis changes in practice
A proper diagnosis identifies the two or three things actually weighing on conversions: a poorly compressed image on the homepage, a third-party script blocking rendering, a font loading last and causing layout shift. Each of these has a measurable cost in lost conversions, and a clear order in which to fix them.
Site speed is no longer a technical detail left to the dev team, it is a directly measurable revenue lever. Before launching a redesign or an acquisition campaign, checking where your site actually stands takes less time than waiting for the next drop in conversions to find out.